We finished our first round in Denver last month, and all the AMODs are back in our possession. We learned a lot during the deployment and are using that knowledge to hopefully improve our AMODs and our CEAMS network.
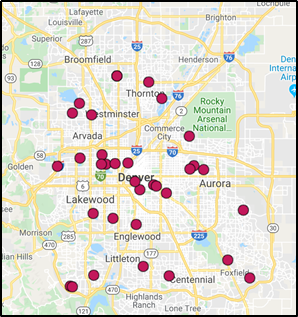
We had 32 citizen scientists from across the Denver-Metro area. Coming from the Community Collaborative Rain, Hail and Snow Network (CoCoRAHS) and the CBS4 community, our citizen scientists have lived in the area for an average of 33 years. CEAMS participants set up our AMODs in their backyards and collected filter measurements, along with taking 2 surveys each. We are grateful for the incredible data that will give us new, local insight into Denver air quality, and that would not have been possible to collect without all of our CEAMS network participants.
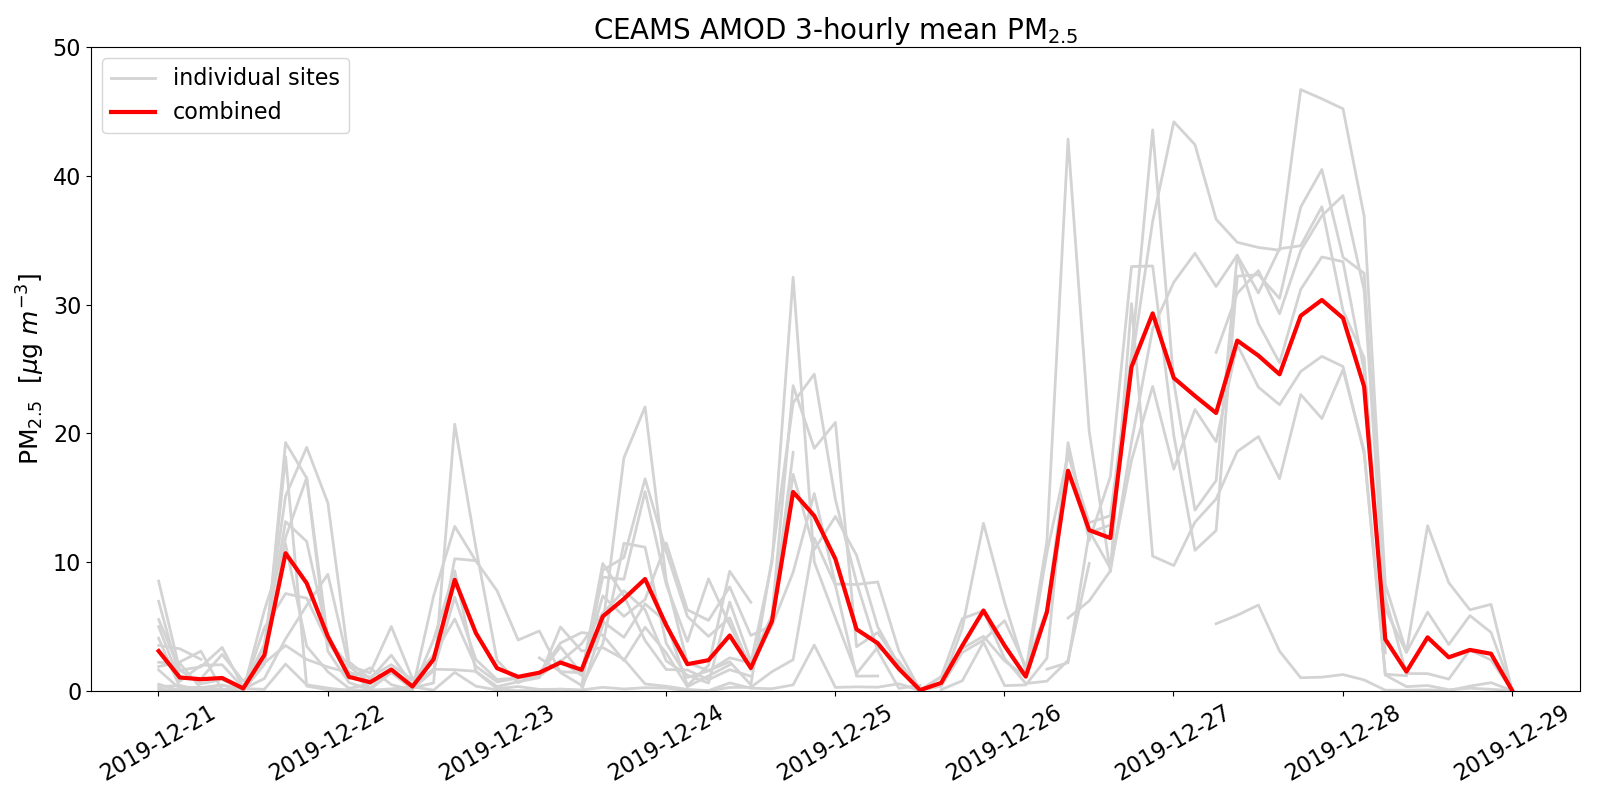
The CEAMS citizen scientists captured nearly 60,000 real-time PM2.5 measurements, over 160 filter PM2.5 measurements, and 1,300 AOD measurements between November 2019 and January 2020. From the collected data, we saw several stagnation events (when air masses sit over Denver and pollutants build up over time), which are a common air quality issue for Denver in the wintertime. An example of one of these events is shown through the time series of the PM2.5 concentrations for December 21st -December 29th, 2019 in the graph below. The red line is the average concentration (average over 3 hours and across all locations) and the faint gray lines are all the individual locations (3 hour average).
In the first part of the time series graph, we see a normal (wintertime) daily cycle in PM2.5. PM2.5 concentrations begin to rise each day in the afternoon, during rush hour, and continue to rise overnight when the boundary layer height is low and the winds are generally calmer. The lowest daily average during this period was on Christmas day (probably because of less traffic as people stayed home and businesses and restaurants were closed). However, a large spike in PM2.5 then occured on Dec. 26th and Dec. 27th with the stagnation event.
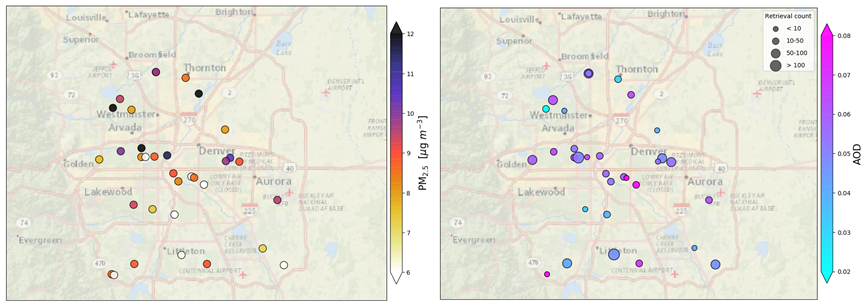
We are also able to see variability in the PM2.5 concentrations in the different areas of Denver. Over the entire time period (November 2019 - January 2020) the average PM2.5 concentration was generally higher in northern Denver (Figure below on left), while the average measured AOD values were similar across Denver (Figure below on right). AOD is a measure of all the aerosols in the atmospheric column (provides a more regional view of air quality), and PM2.5 is a measure of the small particles at the surface (provides a more local view of air quality). Thus, PM2.5 concentrations are going to be more impacted by local emission sources.
We still have much more analysis to do (we have the graduate students hard at work!), but we are already excited about the potential of this data set. We will be adding more data as we are going to be putting out AMODs in Denver again for this spring.
While we have had the AMODs back at our lab, we have been able to recalibrate instruments and make some improvements. Our Denver deployment and feedback from our participants gave us useful insights that led us to improve the mechanical design for the AOD turret, better battery connections, and some major software updates to increase Wi-Fi reliability and sun tracking.

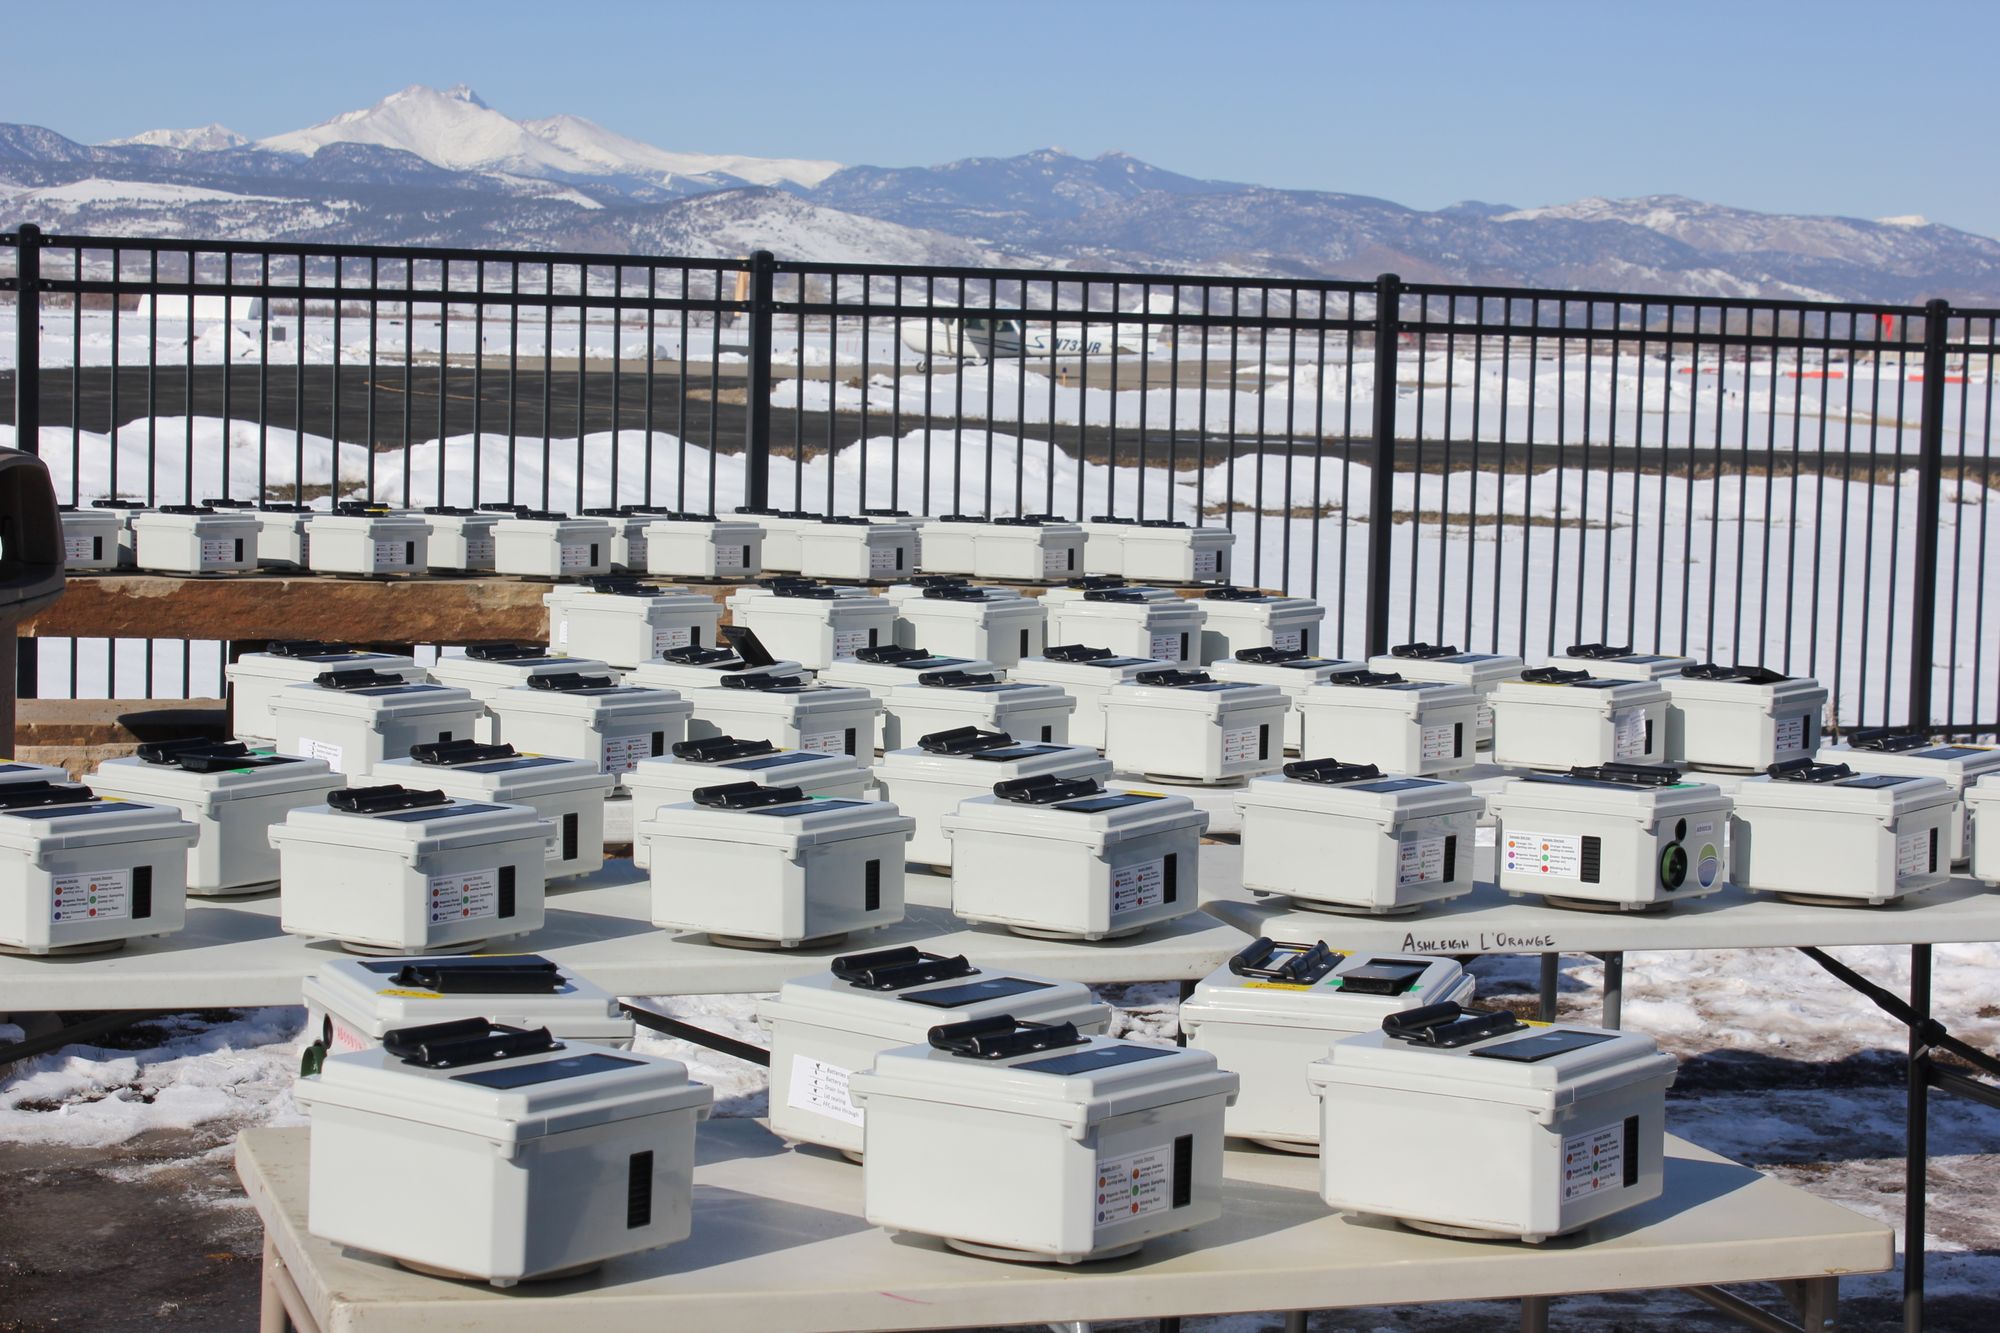
Our first Denver deployment was invaluable in helping us improve the design of the AMOD (thanks, participants, for all your observations and feedback!). We have worked on the mechanical design to improve the motion of the AOD turret and sealed our battery connections to ensure full five-day runtimes. We have also revised the software to improve Wi-Fi reliability and sun tracking. And for those AMODs that got buried in snow and ice back in November and sustained some water damage, we made some repairs and changed our sealing. After all those changes and repairs, we have put all the AMODs through several multi-day functionality tests (picture below).

We are looking forward to wrapping up our final testing and putting our AMODs back out in Denver!
