
by Jessica Tryner
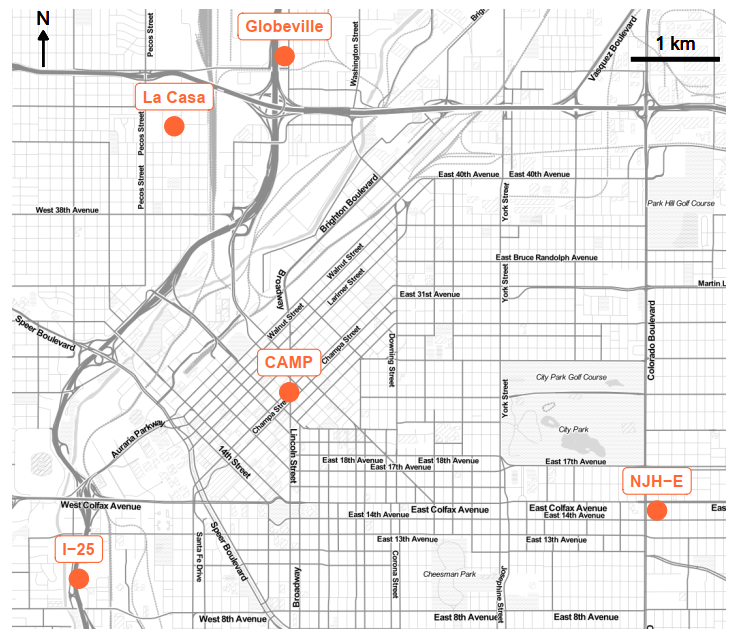
Is Colorado meeting the National Ambient Air Quality Standards? Is the air outside healthy to breathe today? To help answer these questions, the Colorado Department of Public Health and Environment (CDPHE) monitors the mass of fine particulate matter suspended in each cubic meter of air (the “PM2.5 concentration”) at five sites in Denver. These sites are in the Globeville, Sunnyside, Five Points, Hale, and Lincoln Park neighborhoods. The sites in Globeville and Lincoln Park are close to I-25 (see Figure 1).
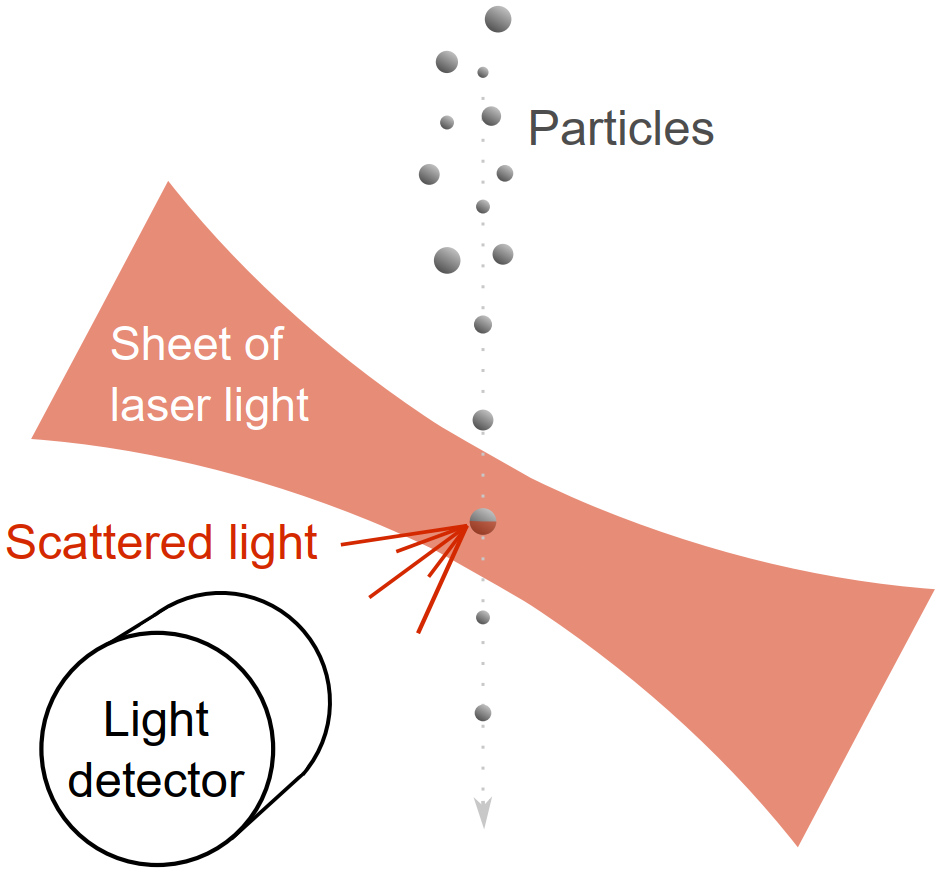
A single monitor (either a GRIMM EDM Model 180 or Teledyne T640) is installed at each site. Each monitor costs tens of thousands of dollars! These monitors determine the PM2.5 concentration in real-time by sampling the air, passing the particles in the air through a sheet of laser light, and measuring the amount of light scattered by each particle (see Figure 2). The monitors used by CDPHE have gone through a lot of testing and are approved by the U.S. Environmental Protection Agency for outdoor monitoring**. You can look up the hourly PM2.5 concentrations reported by the CDPHE monitors here.
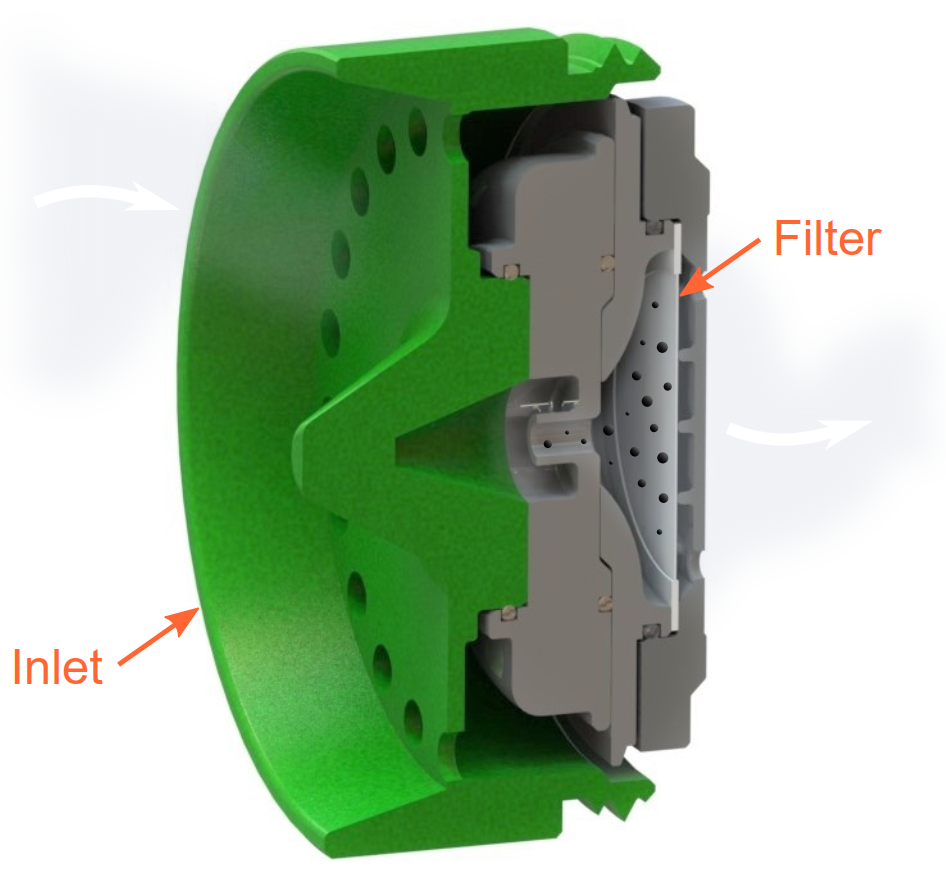
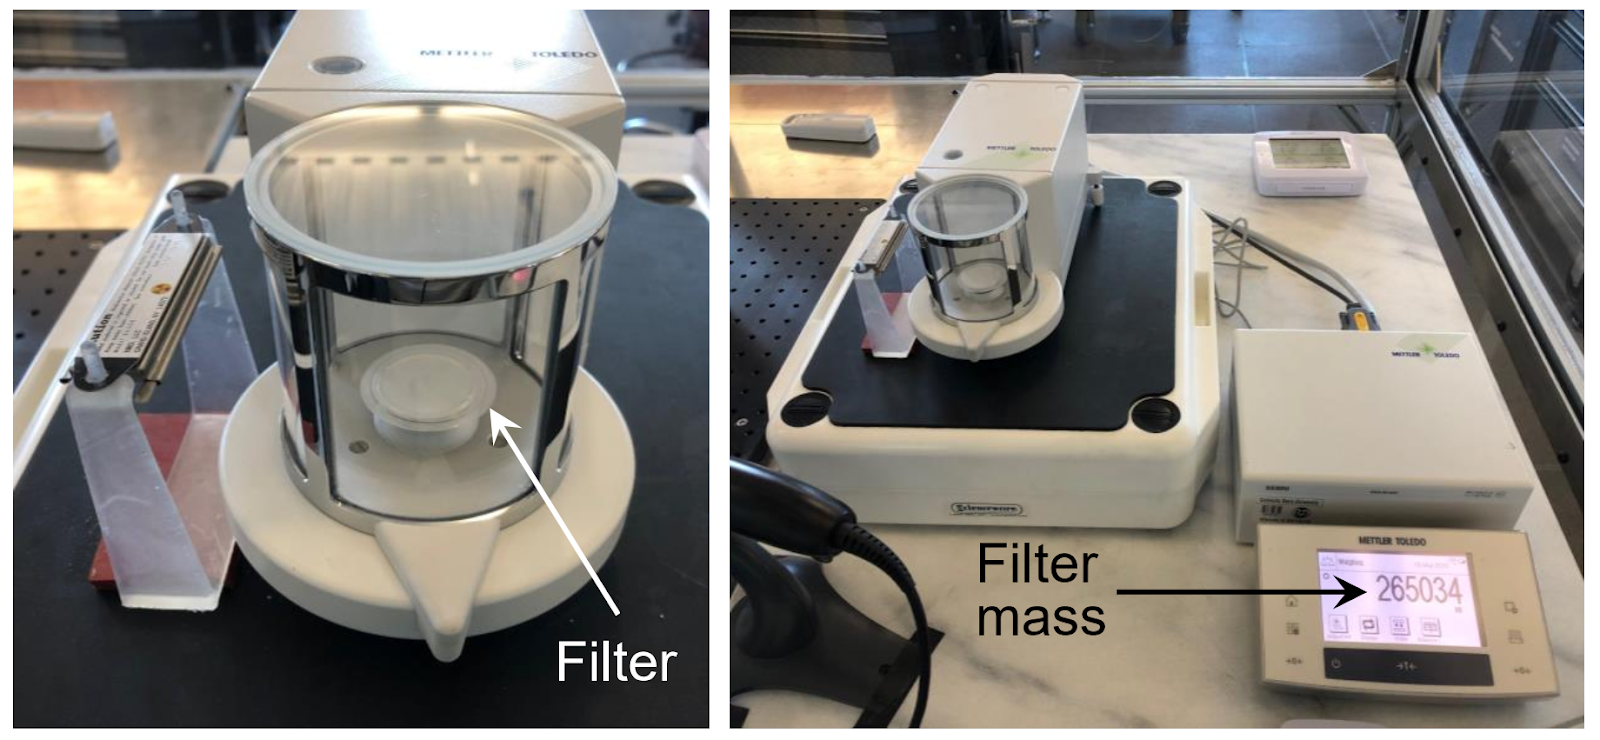
The AMOD is more affordable than the monitors used by CDPHE. One AMOD costs approximately $1000. The AMOD measures the same quantity as the monitors installed by CDPHE (the PM2.5 concentration), but it uses a different approach. First, the AMOD samples air through an inlet that only allows particles smaller than 2.5 μm to enter. Next, the air passes through a filter, where particles in the air are captured (see Figure 3). We weigh the filter before and after sampling to determine the mass of the captured particles (see Figure 4). The AMOD records the volume of air that it pulled through the filter. Finally, we use the known mass of particles and volume of air to calculate the average concentration of PM2.5 in the air sampled by the AMOD over a five-day period.
The AMOD also measures another quantity that the monitors installed by CDPHE do not measure: aerosol optical depth (AOD). What is aerosol optical depth and why do we want to measure it? You can read more about that here!
Because the AMOD is cheaper than the monitors installed by CDPHE, volunteers (like you!) can set up more AMODs across Denver. By putting more monitors in more locations, we can find out how outdoor PM2.5 concentrations vary over shorter distances. What do PM2.5 concentrations look like in your neighborhood? Are they lower than, higher than, or similar to concentrations in other Denver neighborhoods?
How does the AMOD Compare to Low-cost PM2.5 Monitors?
Even though the AMOD is pretty affordable, there are air quality monitors on the market that cost even less. For example, you might have heard of the PurpleAir monitor; there are currently a handful installed around Denver.
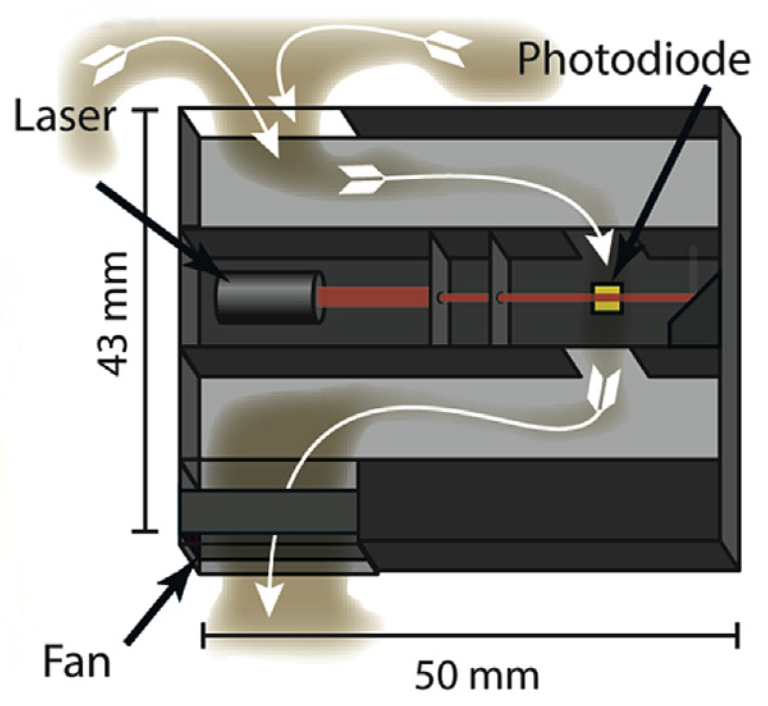
The PurpleAir monitor is popular for a few reasons: it’s small, costs less than $300, requires very little upkeep from the user, and reports PM2.5 concentrations in real-time. Data from PurpleAir monitors are streamed to a website where you can see how PM concentrations vary with time in thousands of locations all over the world.The PM sensors inside of most low-cost monitors, like the PurpleAir, estimate the mass of particles in the air by measuring the amount of light scattered by a group of particles (see Figure 5). Unfortunately, the amount of light scattered by a group of particles depends on more than just the mass of the particles! The amount of light scattered also depends on things like the sizes of the particles. As a result, a low-cost monitor might report a real PM2.5 concentration of 10 μg·m-3 (for example) as 7 μg·m-3, 10 μg·m-3, 15 μg·m-3, or some other value depending on the weather and the sources of the particles***.
In the AMOD, we sample particles onto a filter so that we can measure the mass of particles directly. This approach produces a more accurate measurement of the PM2.5 concentration outside your home. Unfortunately, collecting and analyzing filter samples requires a little more effort from us and from you. We need to pre-weigh each filter and send it to you. You need to regularly replace the filter inside the AMOD and return each used filter to us. After you return your filter, we need to post-weigh it and calculate the PM2.5 concentration in the air that was sampled (learn more here). We think the more accurate measurement is worth this extra effort!
Sources:
*:https://www.epa.gov/outdoor-air-quality-data/interactive-map-air-quality-monitors
**:https://www3.epa.gov/ttn/amtic/files/ambient/criteria/AMTIC_List_June_2017_update_6-19-2017.pdf
