by Bonne Ford
In recent years, we have seen an uptick in large wildfires and smoke events. As the climate continues to get hotter and drier in many places in the West (conditions that are more conducive to starting and spreading wildfires) and the fire season lengthens, we expect this trend to continue. Many ecosystems depend on fire, and fires can be a natural part of a forest’s lifecycle. However, to protect life and property, for much of the last century, the focus was on suppressing fires. This allowed fuels to build up across the U.S.; thus, once fires get started, there is still lots of fuel to burn and keep feeding the fires. We are seeing the number of fire ignitions also increasing, both from natural (lightning) and humans. As more people are moving into the wildland urban interface (WUI) and interacting more with forested lands, fire incidences increase.
In addition to the threat of the fire itself (to life and property destruction), wildfires are also a significant source of PM2.5in the U.S. Regulations have helped to reduce many other emission sources (like from automobiles and industry), and wildfire emissions are now a dominant source of the primary PM2.5 emissions in the U.S. Some models project that this wildfire emission source could continue to increase and offset many of the PM2.5 air quality improvements we have made in the U.S.
We hear about the large fires in the western U.S., but fires occur throughout the U.S. Generally, fires in the East are smaller. There are also more agricultural and prescribed burns in the Southeast and Midwest. These smaller fires produce less smoke but may occur more frequently. While we generally think of the risk of large fires as primarily occurring in the West, the smoke from these wildfires can travel long distances and impact the rest of the U.S. The past few years we have seen significant smoke events in Canada and the western U.S. that have blanketed much of the continental U.S. with heavy smoke.
Our 2021 SARP student measurements caught some of these smoke events. We saw smoke from fires in Canada and the western U.S. impact the air quality at our measurement sites all over the Midwest and eastern U.S. this summer.
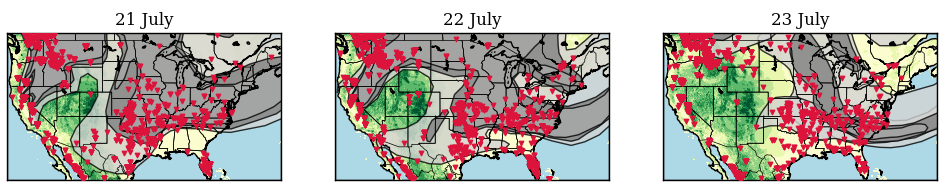
Below is a figure showing the extent of the smoke plumes from a satellite analysis product, the Hazard Mapping System (HMS) Fire and Smoke Product. These show smoke plumes on 21-23 July 2021. The red triangles are locations of fires, and the gray polygons are outlines of smoke (the darker gray represents thicker smoke). On the 21st, we see thick smoke all along the eastern coast. The smoke decreases over the next few days, and the plumes are shifted more through the Midwest and into the southeastern U.S.
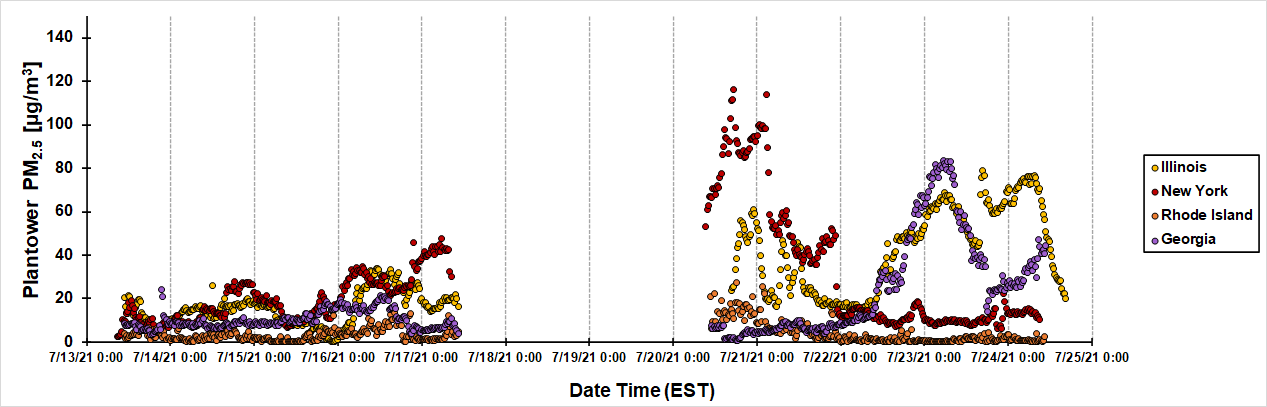
If we look at time series of PM2.5 concentrations (uncorrected values from the AMOD's Plantower sensor) at a few of our SARP locations, we can see that surface concentrations were elevated during this week compared to the previous week (July 13-18, 2021). The higher concentrations coincide with days with smoke. For example, the site in New York has the highest concentrations on the 20thand 21st, while the site in Georgia has the highest concentrations on the 23rd.
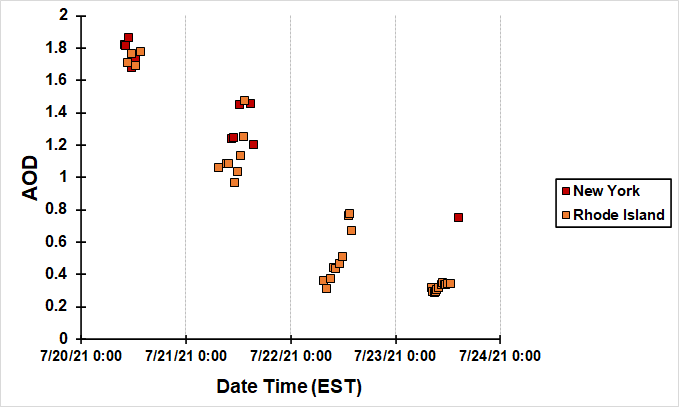
We can also see the enhancement in AOD. The plot below shows AOD measurements from two of the SARP locations on the east coast: New York and Rhode Island. They have similar magnitudes in AOD, but when you compare back to the surface PM2.5 concentrations, the New York site has much higher surface concentrations. This could suggest that more smoke is aloft than at the surface.
For those in SARP this year, you can log into the website (csu-ceams.com) and check out your data to see where your sensor falls for this past week. If you need a reminder, here's a video tutorial on how to interact on the website: https://youtu.be/PSgawuwMBQk
Have you thought about comparing your site with the nearest EPA measurements? You can check out the air quality on their Interactive Map of Air Quality Monitors: https://www.epa.gov/outdoor-air-quality-data/interactive-map-air-quality-monitors
