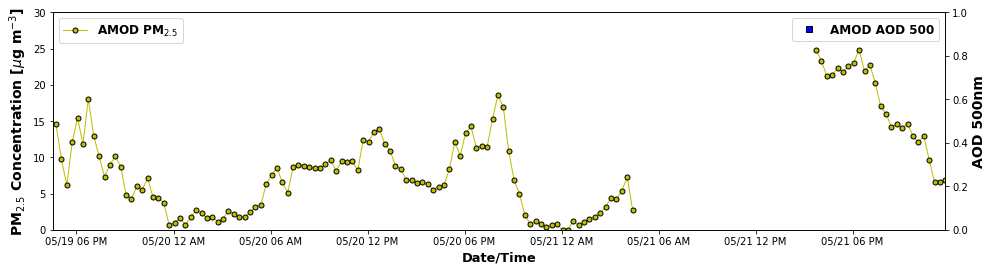
This blog post includes a video to teach you how to download your data from the csu-ceams.com website and then gives you some Python code (uses Pandas) to make a time series plot.
Python Notebook Code to Plot a Data File (CSV) Downloaded from csu-ceams.com
Written by Bonne Ford (bonne@atmos.colostate.edu)
# First, import necessary modules
import pandas
from pandas.plotting import register_matplotlib_converters
register_matplotlib_converters()
import numpy as np
from matplotlib import pyplot as plt
# Read in file to a dataframe

df = pandas.read_csv('C:/Users/bonne/Downloads/amod68_may18.csv')

# Make new variables from the dataframe

# Measurement time
timestamp=np.array(df['timestamp'].copy(), dtype="datetime64[ns]")

# PM2.5 from the Plantower
pm=np.array(df['plantower_pm25'])
# 500 nm AOD (can read in whichever wavelength you are interested in)
aod500=np.array(df['aod_500'])
# Plot timeseries of PM and AOD

# Subset to only include valid PM measurements
good_pmdata=np.where(pm > 0)

# Mask (ie, don't plot) non-measurements (-1111)
good_pm = np.ma.masked_where(pm < 0, pm)

# Figure out the y-axis bounds
ymx=np.around(np.nanmax(pm)/5, decimals=0)*5+5.

# Make sure all windows are closed
plt.close('all')

# Set figure dimensions
fig=plt.figure(1, figsize=(16,4))
ax=fig.add_subplot(111)

# Set Axis Labels
ax.set_xlabel('Date/Time',fontweight='bold',fontsize=13)
ax.set_ylabel('PM$_{2.5}$ Concentration [$\mu$g m$^{-3}$]',fontweight='bold',fontsize=14)
ax.set_ylim(0,ymx)
ax.set_xlim(min(timestamp),max(timestamp))
ax.xaxis.set_major_formatter(mdates.DateFormatter('%m/%d %I %p'))
ax.xaxis.set_major_locator(plt.MaxNLocator(11))

# Plot PM data
ax.plot(timestamp,good_pm,'o',markeredgecolor='k',label='AMOD PM$_{2.5}$',color='y', \
        linestyle='-',linewidth=1,markersize=5)


# Subset to only include valid AOD measurements
good_aod=np.ma.masked_where(aod500 < 0,aod500)

y2mx=np.nanmax(aod500)
if (y2mx > 0):
    ax2 = ax.twinx()
    ax2.set_ylim(0,1)
    ax2.set_ylabel('AOD 500nm',fontweight='bold',fontsize=14)
    ax2.set_xlim(min(timestamp),max(timestamp))
    ax2.xaxis.set_major_formatter(mdates.DateFormatter('%m/%d %I %p'))
    ax2.xaxis.set_major_locator(plt.MaxNLocator(11))
    ax2.plot(timestamp, good_aod,'s',markeredgecolor='k', \
             label='AMOD AOD 500',color='blue',markersize=6)


prop={'size':12, 'weight':'bold'}

ax.legend(loc=2,prop=prop,scatterpoints=1,numpoints=1)
if (y2mx > 0):
    ax2.legend(loc=1,prop=prop,scatterpoints=1,numpoints=1)

plt.show()

fig.savefig('AMOD_timeseries.png',bbox_inches='tight',dpi=300)